Since the data of the data set belongs to multi-dimensional input, in order to have a visual understanding of the data before actually using the data, we choose to use T-SNE as a data pre-processing.
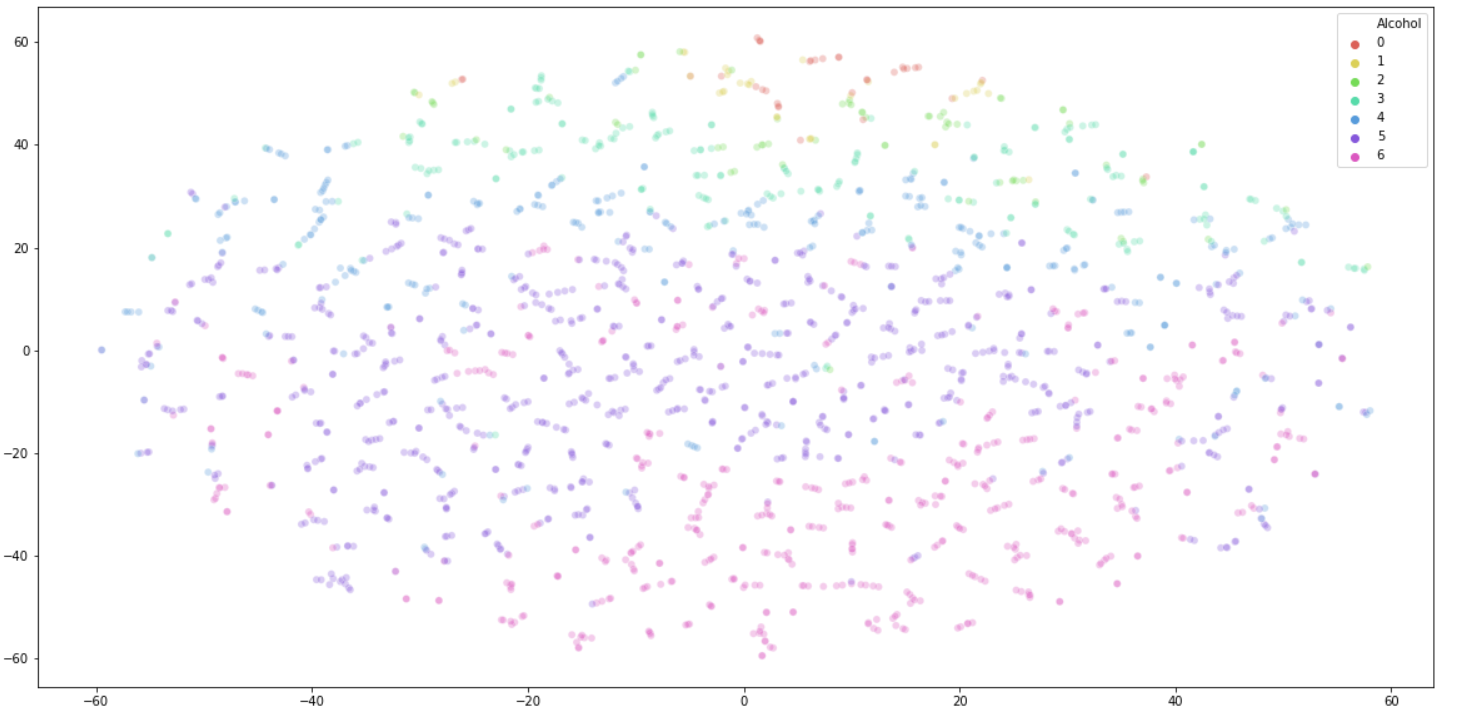
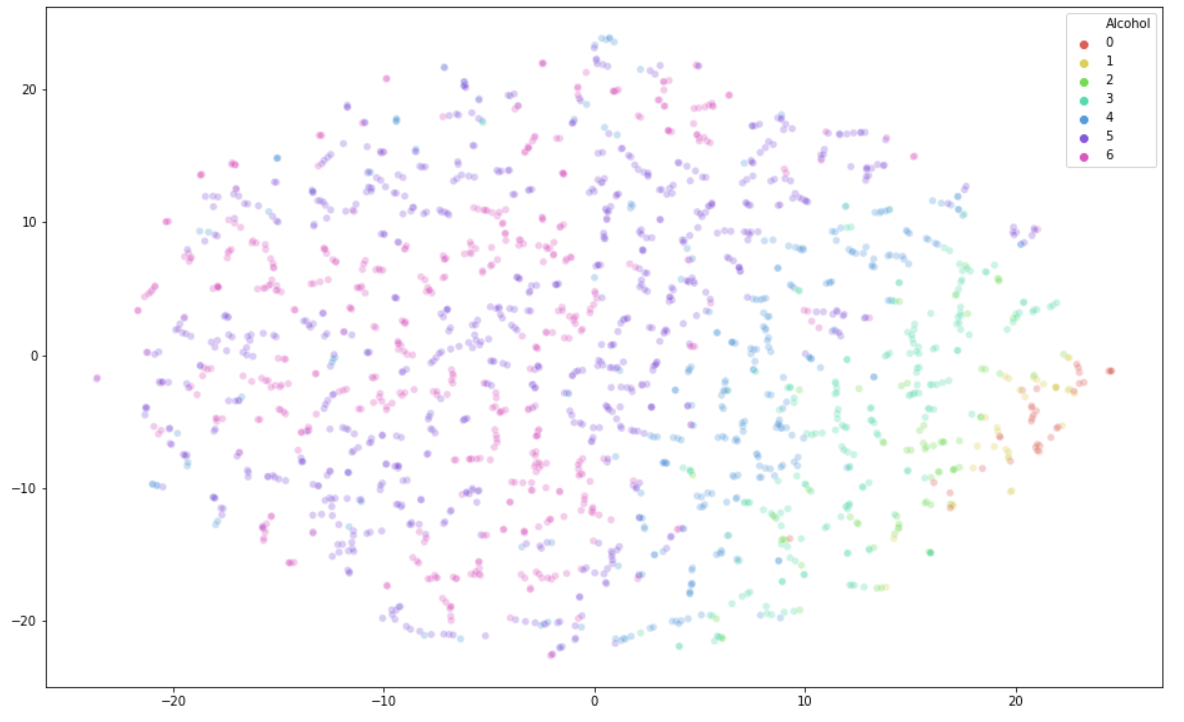
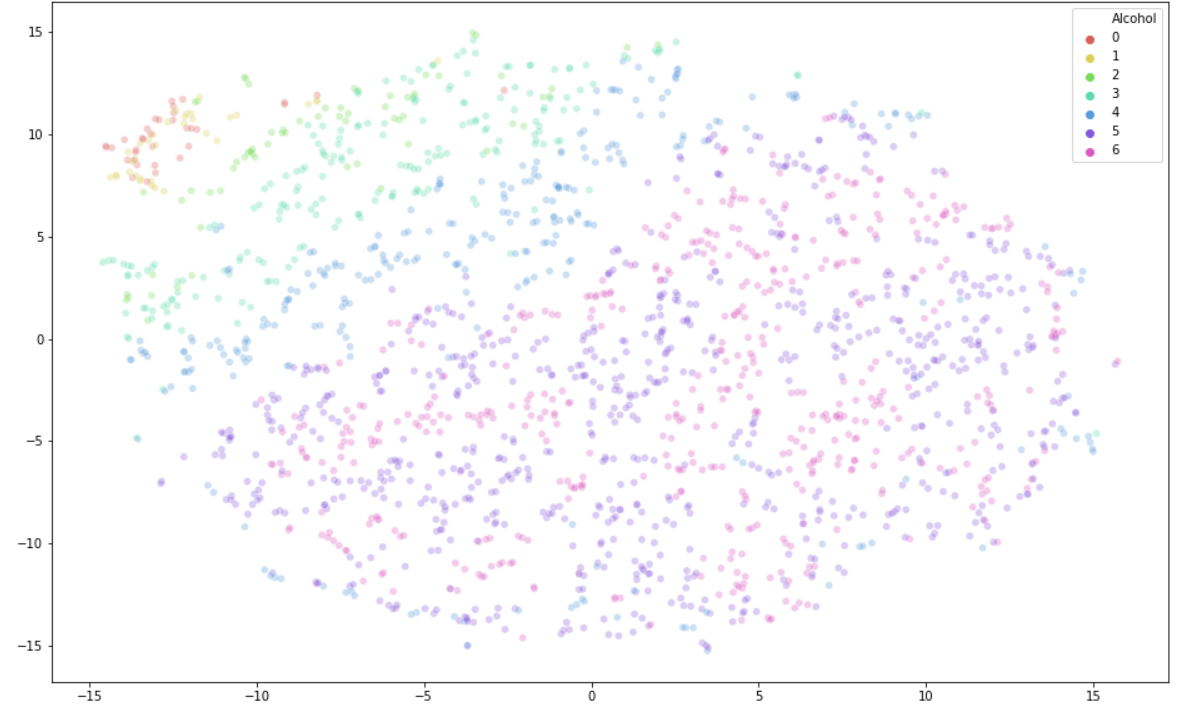
The input of the T-SNE algorithm includes two aspects, one is the data itself, and the other is perplexity. Perplexity can greatly change the visual effect we get. Higher perplexity means that the algorithm treats more high-dimensional data points as adjacent data points, while low perplexity is the opposite.
Result with perplexity=2 Result with perplexity=5
 Result with perplexity=30
Conclusion: From the above results, we can conclude that categories 0-4 have obvious clustering phenomenon, but category 5 (Used in Last Week) and category 6 (Used in Last Day) are difficult to separate different data.
